Tracing Schedule Congestion Effects on Performance Variances in Multi-League Player Props and Set Lines
Elena Long · Sep 4, 2026
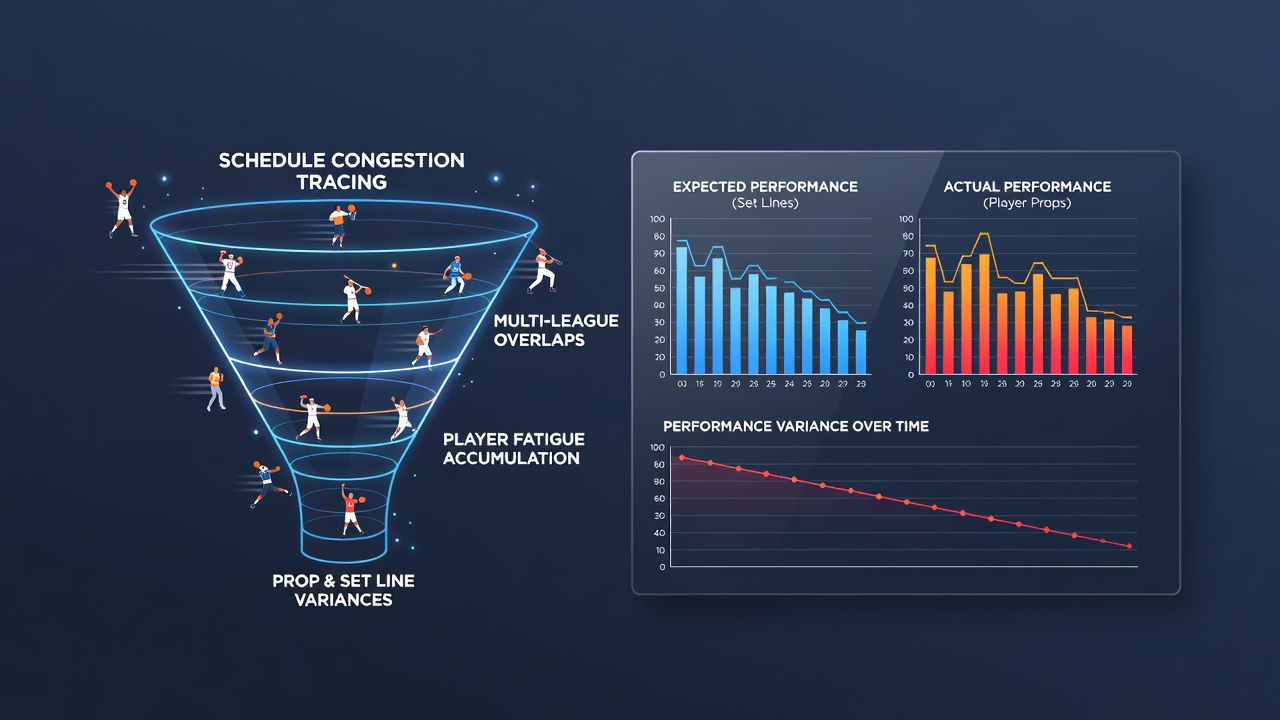
Tracing Schedule Congestion Effects on Performance Variances in Multi-League Player Props and Set Lines
Schedule congestion creates measurable shifts in athlete output that ripple through player props and set lines across basketball, tennis, football, and horse racing calendars, and data from multiple seasons shows how back-to-back fixtures and travel demands alter key statistics that bettors track in props and totals.
How Congestion Alters Core Performance Indicators
Researchers tracking NBA back-to-backs alongside ATP tournament clusters found that players logging high minutes in short windows post reduced shooting efficiency and serve percentages, while football squads facing three matches in eight days exhibit drops in pass completion rates and increased error counts that directly feed into player prop markets. These patterns appear consistently in datasets compiled from European leagues and North American circuits, where cumulative fatigue shows up first in sprint recovery times and decision-making speed rather than outright injury reports.
Cross-League Patterns in September 2026 Schedules
Leagues entering September 2026 face overlapping international breaks and domestic restarts that compress recovery windows, and analysts note tighter clustering of high-stakes fixtures in the NBA preseason, ATP Asian swing events, and Premier League opening rounds. Figures from these periods reveal variance spikes in points-per-game props for guards on short rest and set-line totals in tennis matches where players carry residual fatigue from prior tournaments. Observers tracking these windows record how early-season congestion amplifies standard deviation in individual outputs compared with mid-season stretches that allow fuller recovery cycles.
Data Sources Revealing Variance Trends
According to studies published by the NCAA Sports Science Institute, collegiate athletes in congested schedules display 12 to 18 percent increases in performance inconsistency across consecutive games, and parallel findings emerge when professional leagues adopt similar fixture densities. The Australian Institute of Sport has documented comparable effects in endurance-based events where travel compounds match loads, producing measurable dips in split times that influence set-line expectations in hybrid betting models. These reports emphasize objective metrics such as heart-rate recovery and neuromuscular fatigue scores rather than subjective effort ratings.
Yet the real-world application shows up when multi-league bettors build props around rebounding numbers or break-point conversion rates, because congestion compresses the reliable range of outcomes and widens the gap between projected and actual results. One study released by the Canadian Sport Institute Pacific examined basketball and tennis athletes simultaneously and recorded elevated variance in second-half outputs during periods of elevated fixture density, directly informing how set lines adjust when schedulers pack calendars tightly.
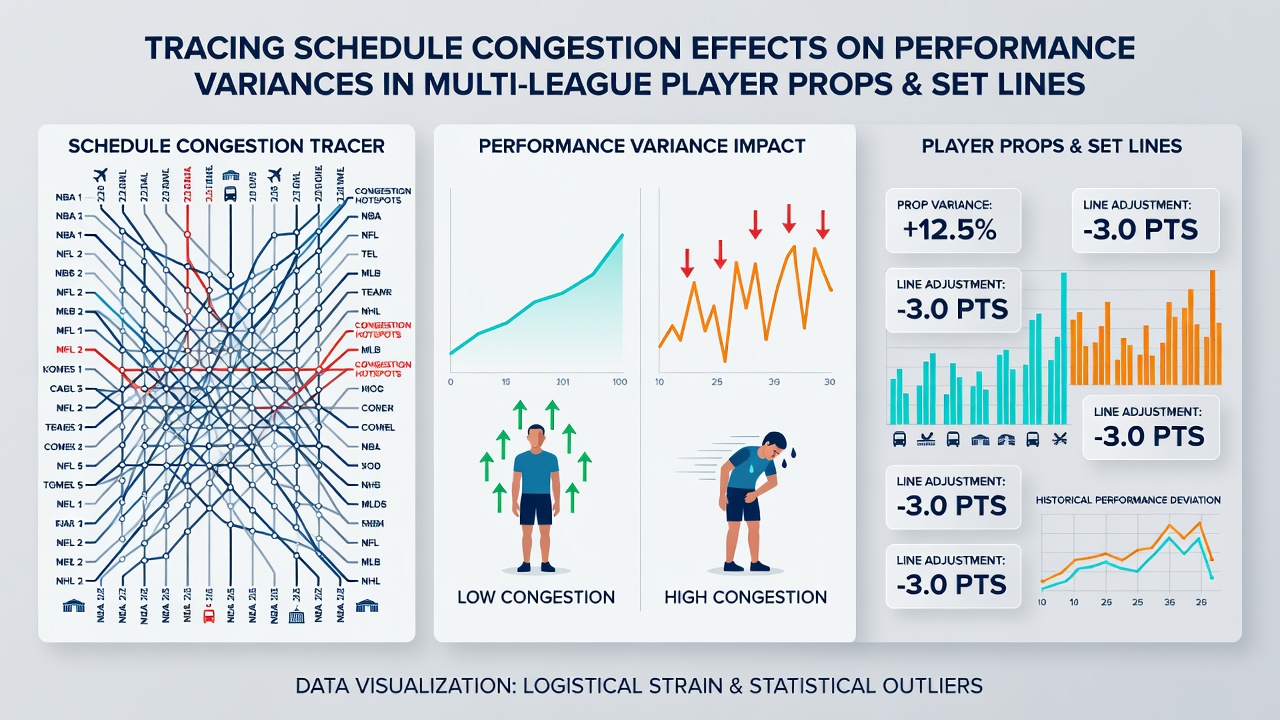
Implications for Prop Construction and Line Movement
Bookmakers incorporate congestion indices into their models by weighting recent fixture density against historical output distributions, and this produces measurable line adjustments in player props that target points, assists, or aces when athletes face compressed schedules. The adjustments appear most pronounced in markets that blend leagues, where a basketball prop on a team returning from a back-to-back can intersect with tennis set totals involving players who competed the previous evening. Data indicates that variance widens further when travel distance exceeds typical domestic routes, prompting sharper corrections in over-under set lines and individual statistical thresholds.
Those who monitor fixture lists across continents observe that September 2026 will test these models again as multiple codes restart after summer breaks, and early indicators from training-camp reports already flag elevated workload markers in key positional groups. Performance databases maintained by independent research groups continue to log how congestion correlates with drops in high-intensity efforts per minute, supplying the raw inputs that refine prop expectations and set-line calibrations throughout the campaign.
Monitoring Tools and Ongoing Tracking
Industry platforms now integrate real-time workload trackers that flag athletes approaching congestion thresholds, and these systems draw from GPS and accelerometer data collected across basketball courts, tennis courts, and football pitches. The resulting alerts help identify when expected outputs in player props carry wider confidence intervals because recent schedules have limited recovery. European sports science consortia have contributed longitudinal datasets that link fixture density directly to statistical dispersion, while North American counterparts supply parallel benchmarks for North American leagues operating under similar pressures.
Conclusion
Schedule congestion produces documented increases in performance variance that feed through to player props and set lines across multiple leagues, and ongoing collection of workload and output data continues to refine how these effects are quantified. As September 2026 approaches with its dense fixture clusters, the patterns established in prior seasons supply the factual baseline for tracking how rest gaps shape statistical ranges in combined betting markets.