Mapping Travel Schedules Against Form Dips in European Football Leagues for Refined Live Spread Selections
Amir Beck · Aug 16, 2026
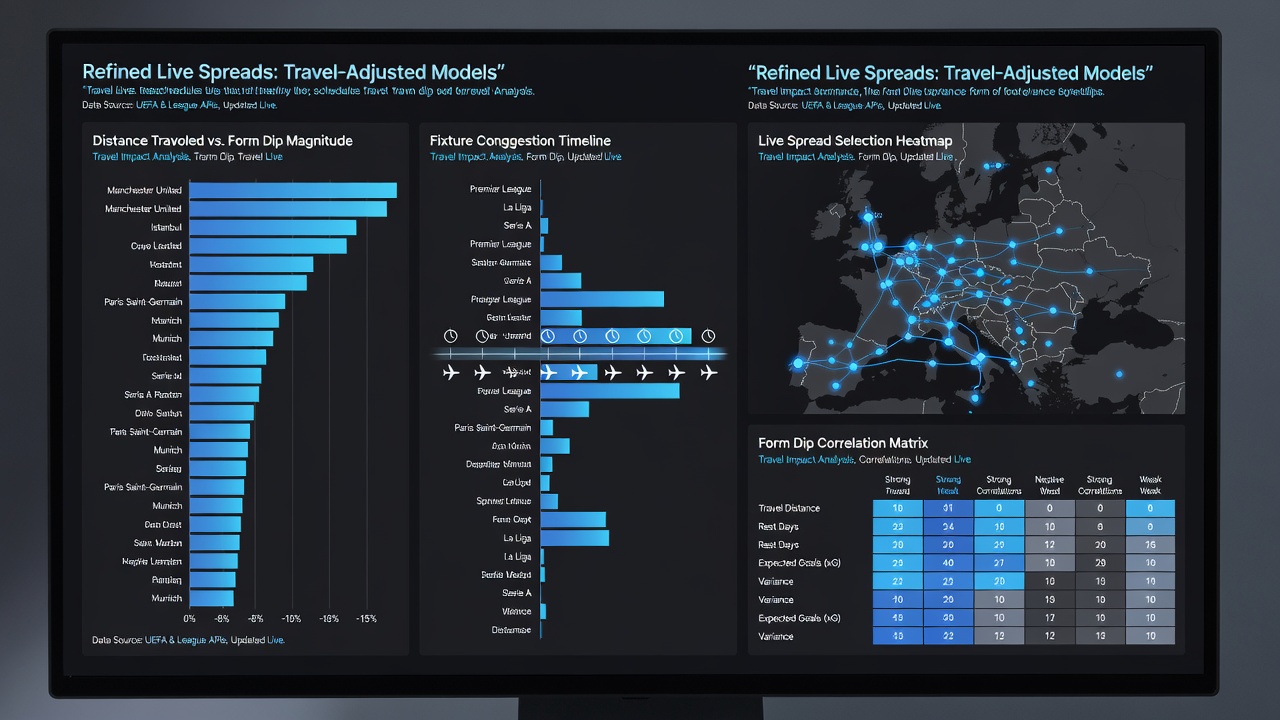
Mapping Travel Schedules Against Form Dips in European Football Leagues for Refined Live Spread Selections
European football leagues present unique challenges for analysts tracking how travel distances intersect with performance fluctuations, and observers note that long-haul trips between matches often align with measurable dips in team output during August 2026 fixtures. Data from major competitions shows clubs covering thousands of kilometers in short windows while facing packed calendars that include domestic cups alongside continental ties, which creates patterns worth examining for live spread decisions. Researchers have compiled schedules from leagues such as the Bundesliga, Serie A, and La Liga to highlight where extended journeys coincide with reduced goal tallies or defensive lapses.
Travel Distances and Their Measurable Effects on Squad Performance
Clubs in the Champions League face cross-continent flights that exceed 1,500 kilometers for some group stage encounters, and figures from the 2025-26 season reveal that teams returning from such trips post lower expected goal values in their next domestic outing. Analysts map these routes against historical performance metrics, noting that recovery windows under 72 hours frequently precede slower build-up play and fewer successful passes in midfield zones. Studies conducted by sports science groups indicate that sleep disruption from time zone shifts contributes to elevated error rates in high-pressure situations, which in turn influences how bookmakers adjust live handicap lines once matches begin.
Detecting Form Dips Through Integrated Schedule Analysis
Form dips become clearer when travel logs sit alongside possession statistics and set-piece conversion rates, because teams that log multiple away legs in succession show consistent drops in aerial duel success. Observers tracking the Premier League and Ligue 1 have documented cases where squads arriving home after Wednesday night fixtures in Eastern Europe struggle to maintain pressing intensity on the following Saturday, producing wider margins in live spread markets. Data indicates that these patterns repeat across seasons, allowing refined models to flag specific player roles most affected by fatigue, such as full-backs who cover extra ground during recovery phases.
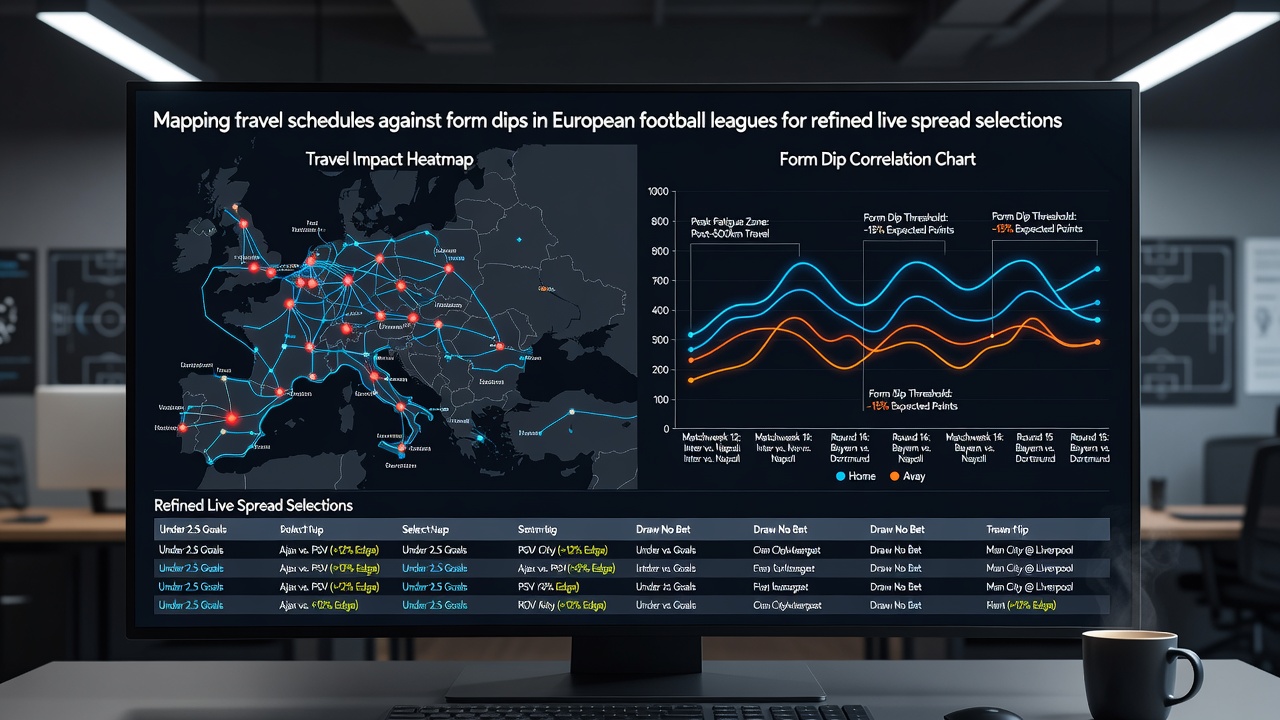
Applying Mapped Data to Live Spread Markets
Live spread selections gain precision when operators overlay real-time travel data onto in-game statistics, since early indicators of fatigue often surface within the first 15 minutes of a match. European leagues release fixture lists months in advance, yet last-minute schedule adjustments from television broadcasters can shorten recovery periods further, and analysts adjust their projections accordingly. Research from the FIFA Training Centre demonstrates that teams with documented long-distance travel exhibit measurable reductions in sprint frequency during the opening half, which directly informs spread lines on total corners or player-specific goal contributions once play starts.
Those who monitor multiple leagues simultaneously discover that certain clubs maintain stricter travel protocols involving chartered flights and on-site recovery teams, whereas others rely on commercial routes that extend fatigue windows. This variance creates exploitable differences in how form dips manifest across competitions, particularly when midweek European matches precede weekend domestic spreads. August 2026 schedules already highlight several high-travel clusters involving Scandinavian and Eastern European sides, where historical data shows elevated instances of underperformance in subsequent home games.
Regional Variations Across Major Leagues
Italian clubs traveling within Serie A encounter shorter distances than their Spanish counterparts who cross the Iberian Peninsula regularly, yet both groups display form dips when international breaks insert additional flights. League-specific studies reveal that Bundesliga teams benefit from central locations that reduce average travel time, but Champions League participants from Germany still face measurable output drops after long returns. Analysts therefore combine league geography with individual club travel histories to refine live spread parameters, focusing on metrics such as distance covered per player and pass completion under pressure.
Conclusion
Mapping travel schedules against documented form dips supplies a structured framework for evaluating live spread opportunities across European football, and the approach continues to evolve as new data streams from wearable technology and fixture analytics become available. Teams and analysts alike benefit from systematic tracking that accounts for recovery time, route complexity, and historical performance correlations, which together shape more accurate in-play adjustments throughout the 2026-27 campaign and beyond.